- This topic is empty.
-
AuthorPosts
-
-
December 12, 2025 at 3:14 am #11138
Kris Marker
KeymasterLocal jails and police departments are key to the Trump administration’s mass deportation agenda because they facilitate ICE arrests of people who are already in police custody. In the first year of Trump’s second term, the administration has intensified the criminalization of asylum seekers and immigrants, pushed immigrant detention to all-time highs, and indiscriminately raided city after city. Despite all of this, the Trump administration remains well behind their mass deportation goals, in large part due to state and local efforts to protect immigrant communities and limit cooperation with ICE, Border Patrol, and other federal agencies.
In this briefing, we provide an update to our July 2025 report, Hiding in Plain Sight, which explored how local jails obscure and facilitate mass deportation under Trump. Using new government data provided by ICE and processed by the Deportation Data Project, we found high levels of ICE arrests — over 1,000 a day — concentrated in states that fully collaborate with the Trump administration.1 Nearly half (48%) of these arrests happen out of local jails and other lock-ups.2 We also provide updated data tables showing both the numbers and rates of ICE arrests by state.
A whirlwind of developments in the past year have changed how the immigration system works. The Trump administration has made it harder for people to make claims in immigration court, and deployed plain-clothes federal agents to arrest people that show up for hearings. They have limited access to legal information and attorneys while people are detained, and tried to eliminate regular types of release from detention like bail. Further, they fired immigration judges unaligned with their mass deportation agenda, and advertised their positions as those of “deportation judges.” Accordingly, immigration judges now frequently function as a rubber stamp on the regime’s actions; the case-by-case, inherently individualized decision of whether or not to detain and deport someone has shifted away from judges in courtrooms to the cops on the streets.
Meanwhile, ICE agents are given arrest quotas and required to detain nearly everyone they suspect lacks U.S. citizenship. They are heavily reliant on local police to arrest people and identify them for later pick up from the local jail by ICE agents, often before any criminal charges have been resolved (whether dismissed, acquitted, or convicted). To be clear, large numbers of ICE arrests at local jails are not an indication that immigrants and asylum seekers are more likely to be arrested for a crime; robust data from Texas, for example, showed that undocumented immigrants had much lower arrest rates than U.S.-born citizens. In too many cases, a traffic stop can mean deportation.
Nonetheless, these changes mean that local law enforcement across the U.S. have day-to-day operational discretion about who is detained and deported from communities. States like Florida, Texas, Louisiana, and Georgia have required local law enforcement to deputize staff to serve ICE, leading to high numbers of arrests.3 Others like Illinois, New York, and Oregon have managed to suppress arrests by limiting cooperation and blocking access to sensitive areas of public buildings. And states like New Jersey, which have prohibited formal deputization while allowing federal agents informal access to people in custody, have swept hundreds of people out of local jails and into the hands of ICE.
Local jails remain a key part of ICE’s arrest apparatus
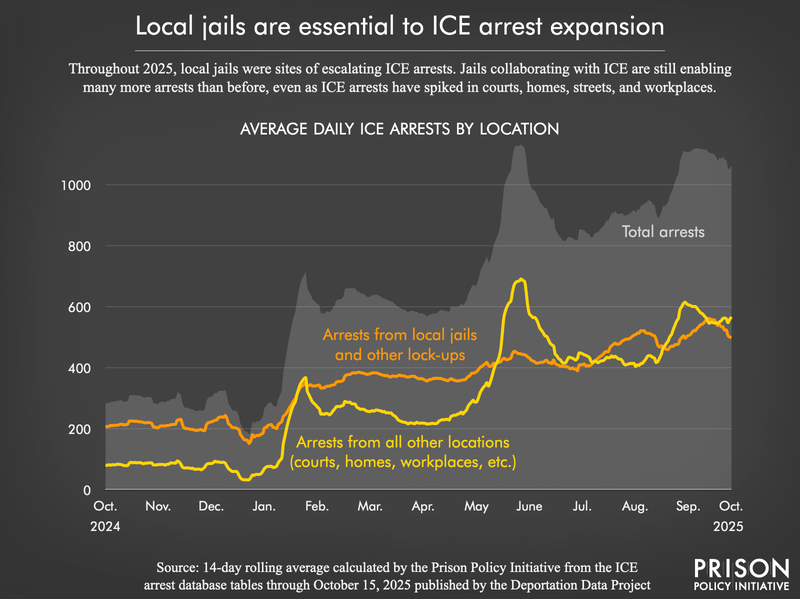
Nationally, the recently-obtained ICE arrest data show indiscriminate levels of community arrests and detention. Using a 14-day rolling average number of arrests to smooth out the daily data,4 we found that major policy shifts led to higher levels of ICE arrests around the time of Trump’s inauguration in January, and again in late May as White House staff pressured ICE to escalate community raids to reach 3,000 arrests per day. Already-high rates of arrests out of local jails and other lock-ups seen earlier in 2025 have been amplified, although not as much as community raids and arrests elsewhere. As discussed below, the story becomes more complicated when looking at individual states, because the scale of arrests at least partially depends on state and local policies regarding cooperation with federal agents.
Throughout 2025, ICE made more and more arrests at local jails and other lock-ups, reaching an average of 350 per day in late January, and then continuing to rise to more than 500 a day on average in August. Arrests in other locations peaked in late May and early June at an average of almost 700 a day, and ICE averaged over 600 a day in September.5
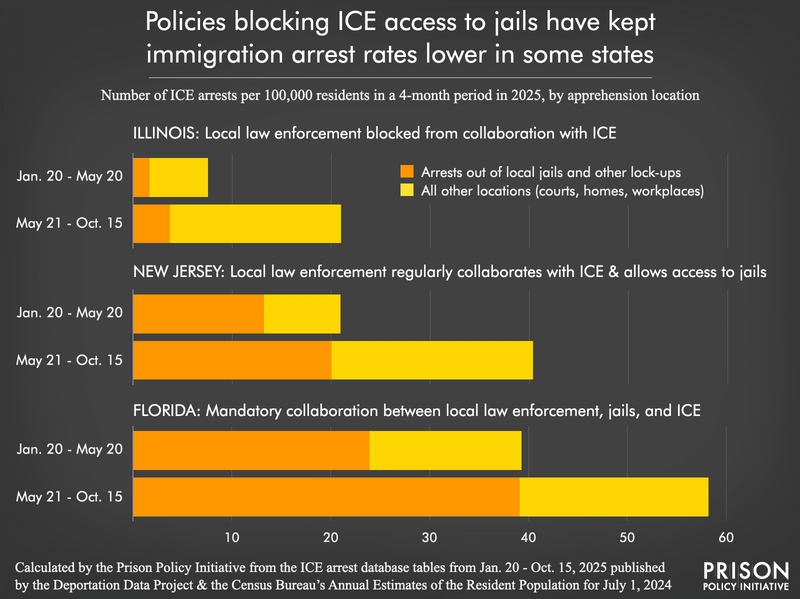
State cooperation with ICE: As one might expect, states that mandate local collaboration with federal law enforcement often have higher levels of ICE arrests, with places like Tennessee, Florida, and Texas among the most extreme examples. To understand the impact of changes to immigration enforcement this year, our analysis6 compared arrests made between January 20 and May 20 to those made between May 21 and October 15. We found that Texas has the highest overall ICE arrests in this data, and their ICE arrest rate nearly doubled from the first to second period, from about 58 per 100,000 state residents to 110 per 100,000.
Florida and Tennessee have the highest arrest rates out of local jails and other lock-ups specifically. Between the January to May and May to October to periods of our analysis, the overall ICE arrest rate in Tennessee rose by 40%, from 35 to 49 per 100,000 people. In Florida, 67% of ICE arrests were out of local jails or other lock-ups and the overall ICE arrest rate in the state rose by nearly 50%, from 39 to 58 per 100,000.
Impact of strategies to block ICE: Meanwhile, the impact of state and local strategies to block ICE access to jails is visible in data from Illinois, New York, and Oregon, where ICE arrests remain lower than other states. Between the January to May and May to October period in Illinois, the ICE arrest rate almost tripled, from nearly 8 per 100,000 people to 21 per 100,000. New York’s rate went from 9 to 26 per 100,000 (a 179% increase), and Oregon’s from 5 to 13 per 100,000 (a 160% increase). While these growing rates of arrest are troubling, the overall levels are much lower than in other states. In all three states, arrests out of local jails and other lock-ups composed a small share of ICE arrests, around 1 in 10 in Oregon and New York, and 1 in 6 in Illinois.7
Each state has approached the situation differently. Illinois, for example, has the strongest policy to prevent ICE from gaining access to people while they are in local jails. Guidance from the Illinois Attorney General states that local law enforcement:
- “May not transfer any person into an immigration agent’s custody;
- May not give any immigration agent access, including by telephone, to any individual who is in the law enforcement agency’s custody;
- May not permit immigration agents’ use of agency facilities or equipment, including the use of electronic databases not available to the public, for any investigative or immigration enforcement purpose; and
- May not otherwise render collateral assistance to federal immigration agents, including by coordinating an arrest in a courthouse or other public facility, transporting any individuals, establishing a security or traffic perimeter, or providing other on-site support.”
There are narrow exceptions to this prohibition, such as when ICE has a criminal arrest warrant, and gaps between the law on the books and what actually happens in practice. But Illinois requires local law enforcement to provide details on how they respond to every request made of them by immigration agents, and subsequently shares that information with the public.8
Informal access to jails facilitates collaboration and blunts efforts to block ICE
States like New Jersey have found themselves in a third position between mandatory deputization of local police and state-wide policy that prohibits collaboration. This waffling has led to a surge in ICE arrests from jails and other lockups. As recent ICE arrest data show, the rate of arrests in New Jersey almost doubled in the May to October period, from 21 to 40 per 100,000 people, and a large share took place out of local jails.
How did this happen? New Jersey prohibits local police and sheriffs from being deputized by ICE under the 287(g) program, terminating those agreements in 2019 via an executive order from the Attorney General.
Despite the prohibition on formal 287(g) agreements, some local sheriffs have collaborated with ICE in other ways, and traffic enforcement and other arrests still lead to ICE arrests out of lock-ups and jails at a very high rate.9 For example, news reports indicate that Morris County jail and other pretrial detention facilities across New Jersey allow ICE to enter and make arrests. Morris County Sheriff James Gannon, in November 2017 described it this way:
“We have a working relationship with those authorities at our jail. They come in, and they check, you know, every other day they’re in our jail, right now. So I don’t see a need as we sit there right now to do anything on the 287(g). But we are going to maintain cooperation with the authorities with regards to issues of immigration […] If the immigration authorities are coming in and they’re satisfied and we’re satisfied that they’re dealing with the people who are here illegally, then let’s leave it like that.”
This tension between independent sheriffs and state limits on collaboration with ICE recently rose to the surface during the governor’s race in 2025. The Republican candidate, Jack Ciattarelli, chose Sheriff Gannon as his running mate and campaigned on working more closely with ICE and even deputizing local police to serve as immigration agents. Ciattarelli and Gannon lost their election, but ICE arrests that involve collaboration with local law enforcement have continued at a high level in New Jersey compared to states like Illinois, Pennsylvania, or New York.
Conclusion
Despite overwhelming displays of power and intimidating rhetoric, the federal government nonetheless relies heavily on state and local collaboration to enact its mass deportation agenda. The Trump administration is therefore vulnerable to state and local policy action that goes beyond merely limiting sheriffs and police from deputizing officers to work as immigration agents. This weakness is evident in the data, which show significantly smaller jumps in arrest rates in states where advocates have most aggressively worked to reject collaboration, and much higher rates in states that have embraced it. In the case of New Jersey, it’s clear that moderation on ICE collaboration does little to stem rates of arrest. Advocates targeting ICE’s reliance on local jails could potentially save thousands of people from the horrors of torture and abuse in federal custody and deportation.
Methodology
ICE arrest data were obtained via FOIA request and processed by the Deportation Data Project, which were then analyzed by the Prison Policy Initiative.
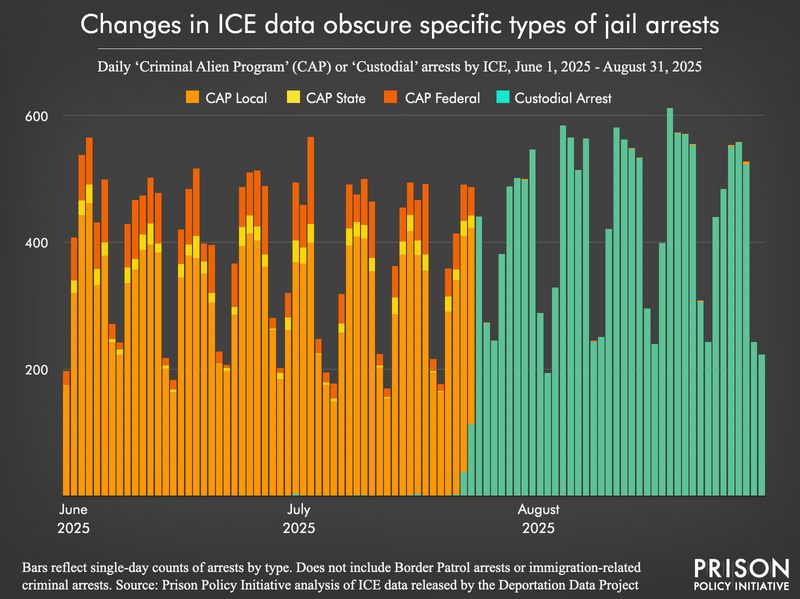
Data corrections: ICE data contained a large number of cases with incomplete location information, and ICE’s coding and categorization practice has shifted over the course of 2025, obscuring important details. For data tables and visualizations in this briefing, we categorize ICE’s arrest locations data as “local jails or other lock-ups,” and a residual category of “all other locations,” including streets, workplaces, homes, and courts. As of the last week of July 2025, ICE stopped reporting arrests that occurred via the various local, state, and federal “Criminal Alien Programs” and instead reported all of those cases under the generic category “Custodial Arrests.” There are some ICE arrests directly from state or federal prisons, but many of the arrests coded as occurring via ICE’s federal or state so-called “Criminal Alien Program” actually happened at local jails after people were transferred there. The vast majority of custodial arrests occur at local jails, and thus in this briefing we use a combined category of “local jails or other lock-ups.”
The Deportation Data Project also identified that some records appear to be duplicated in the arrest table, so we removed extra rows that involve a person being booked into ICE custody more than once in a single day.
14 day rolling average arrest counts: This metric helps smooth out the daily data variation into trends, and is calculated using a sum of all arrests over two weeks divided by 14 to get the average daily arrest rate in the period. For example, October 14’s number is the average number of arrests for October 1-October 14.
Standardizing comparison across states: We carefully added the missing state for arrests based on the information ICE provided on apprehension location. Around 15% of the rows in the ICE arrest table do not include a state, but using the information in the table (such as the detailed apprehension location or the ICE office responsible) we deduced the location of the arrest for nearly nine out of ten of these cases. This approach does not work in Washington D.C., however, because so many arrests remain ambiguous or assigned to the ICE office responsible for both Washington D.C. and Virginia, so these two areas are combined for this analysis.
Data from some states may be incomplete due to ICE procedures for processing arrests. According to a declaration by the director of the Chicago field office in a federal civil rights lawsuit, in mid-September 2025, they sent an “entire plane” full of 131 people who had been arrested in the Chicago area but had not been processed by ICE yet to El Paso for processing there. Using the ICE arrest and detention data from the Deportation Data Project’s most recent release, it was not possible to clearly identify those people among the set of cases that were arrested in Illinois, nor those that were first detained in El Paso during that time, due to limitations in the datasets (missing identifiers in particular).
Standardizing comparison across time periods: In order to meaningfully compare changes during the first year of the second Trump administration, we broke ICE arrest data into two periods: a first period from January 20 to May 20, 2025 and a second period from May 21 to October 15, 2025. This approach provides a view into how conditions have changed since ICE arrests ramped up earlier this summer.
Because the data periods are not the same length, we standardized the data to represent the number of arrests if the period was exactly four months long to make the rates comparable. This approach also avoids truncating arrest data unnecessarily at the start or end of time periods, which would discard useful data. For the latter 128 day period from May 21 to October 15, we reduced the counts within each state by 4.9% to account for what they would be in a shorter 121 and two-thirds days period. The earlier 121 day period (January 20 to May 20) is increased slightly to account for the missing two-thirds of a day.
We chose to divide the periods in this way due to the May 20th meeting called by White House deputy chief of staff Stephen Miller with ICE senior officials demanding a million deportations in Trump’s first year and a tripling of arrest efforts to a target of 3,000 arrests per day.10 Subsequent to that meeting, ICE and Border Patrol began to occupy downtown Los Angeles and raid California more aggressively, followed by Washington, D.C.; Portland, Oregon; and Chicagoland. Data covering ICE and Customs and Border Protection’s more recent efforts in North Carolina, Louisiana, Minnesota, and elsewhere have not yet been made public.
In order to make comparisons between states, we calculate arrest rates per 100,000 residents (based on 2024 U.S. Census state-level population estimates), which we provide in Appendix Table 2.
Read the entire methodology
Appendix Tables
Appendix Table 1: ICE arrests by apprehension location (Jan. 20 to Oct. 15, 2025)
The following table presents ICE arrests from the first year of the second Trump administration as a state-by-state count for two time periods: period 1 from Jan. 20 to May 20, 2025, and period 2 from May 21 to Oct. 15, 2025. Since this data does not include all immigration-related arrests, like those by Customs and Border Patrol, caution is required in making interpretations. State locations were filled in by the combination of the ICE office area responsible and the information provided about specific arrest locations. This was not sufficient to identify a clear estimate for Washington D.C., which was combined with Virginia. Arrest rates were calculated using 2024 state population estimates from the U.S. Census. For more about the data see the methodology. Additional data is available upon request.
Jan. 20 – May 20, 2025 May 21 – Oct. 15, 2025 State name Jails and other lock-ups Workplaces, homes, community, courts, others Total arrests Jails and other lock-ups Workplaces, homes, community, courts, others Total arrests Alabama 1114 224 1338 1572 492 2064 Alaska 3 22 25 4 22 26 Arizona 1513 946 2459 2754 1858 4612 Arkansas 674 357 1031 960 452 1412 California 1541 2842 4383 3379 12152 15531 Colorado 481 917 1398 603 1667 2270 Connecticut 26 275 301 47 428 475 Delaware 40 102 142 58 237 295 Florida 5560 3577 9137 9613 4693 14306 Georgia 1880 1277 3157 2108 3477 5585 Hawaii 32 79 111 31 55 86 Idaho 204 69 273 352 76 428 Illinois 210 747 957 496 2311 2807 Indiana 874 249 1123 1242 378 1620 Iowa 369 61 430 703 127 830 Kansas 517 258 775 832 274 1106 Kentucky 587 196 783 919 310 1229 Louisiana 848 571 1419 1207 945 2152 Maine 19 58 77 39 109 148 Maryland 418 775 1193 496 1444 1940 Massachusetts 128 1786 1914 254 2961 3215 Michigan 331 447 778 589 1039 1628 Minnesota 253 340 593 316 864 1180 Mississippi 613 125 738 782 163 945 Missouri 518 192 710 735 254 989 Montana 36 14 50 51 2 53 Nebraska 294 182 476 432 337 769 Nevada 634 298 932 1098 346 1444 New Hampshire 36 103 139 46 88 134 New Jersey 1248 729 1977 2002 2033 4035 New Mexico 148 146 294 237 248 485 New York 258 1611 1869 591 4927 5518 North Carolina 918 446 1364 1364 661 2025 North Dakota 70 12 82 82 61 143 Northern Mariana Islands 32 12 44 36 34 70 Ohio 615 269 884 930 848 1778 Oklahoma 774 510 1284 1176 1147 2323 Oregon 13 203 216 61 534 595 Pennsylvania 536 1314 1850 759 2856 3615 Puerto Rico 0 2 2 0 0 0 Rhode Island 76 140 216 66 196 262 South Carolina 1042 233 1275 1460 363 1823 South Dakota 147 32 179 211 32 243 Tennessee 1841 668 2509 2754 988 3742 Texas 13330 4697 18027 21137 15103 36240 Utah 823 369 1192 1278 547 1825 Vermont 0 2 2 1 4 5 Washington 135 403 538 336 1127 1463 West Virginia 74 44 118 153 81 234 Wisconsin 239 77 316 406 219 625 Wyoming 113 34 147 220 37 257 Combined Virginia and Washington D.C. 1070 1822 2892 1776 4063 5839 Total 43326 31217 74543 68770 74205 142975 See appendix table 1
Appendix Table 2: ICE arrest rate per 100,000 residents, by apprehension location (Jan. 20 to Oct. 15, 2025)
The following table presents ICE arrests from the first year of the second Trump administration as a state-by-state rate per capita for two time periods: period 1 from Jan. 20 to May 20, 2025, and period 2 from May 21 to Oct. 15, 2025. Rates are standardized to a four-months period. Since this data does not include all immigration-related arrests, like those by Customs and Border Patrol, caution is required in making interpretations. State locations were filled in by the combination of the ICE office area responsible and the information provided about specific arrest locations. This was not sufficient to identify a clear estimate for Washington D.C., which was combined with Virginia. Arrest rates were calculated using 2024 state population estimates from the U.S. Census. For more about the data see the methodology. Additional data is available upon request.
Jan. 20 – May 20, 2025 May 21 – Oct. 15, 2025 State name Jails and other lock-ups Workplaces, homes, community, courts, others Total arrest rate per 100,000 residents Jails and other lock-ups Workplaces, homes, community, courts, others Total arrest rate per 100,000 residents Alabama 21.7 4.4 26.1 29.0 9.1 38.0 Alaska 0.4 3.0 3.4 0.5 2.8 3.3 Arizona 20.1 12.5 32.6 34.5 23.3 57.8 Arkansas 21.9 11.6 33.6 29.5 13.9 43.5 California 3.9 7.2 11.2 8.1 29.3 37.4 Colorado 8.1 15.5 23.6 9.6 26.6 36.2 Connecticut 0.7 7.5 8.2 1.2 11.1 12.3 Delaware 3.8 9.8 13.6 5.2 21.4 26.7 Florida 23.9 15.4 39.3 39.1 19.1 58.2 Georgia 16.9 11.5 28.4 17.9 29.6 47.5 Hawaii 2.2 5.5 7.7 2.0 3.6 5.7 Idaho 10.2 3.5 13.7 16.7 3.6 20.3 Illinois 1.7 5.9 7.6 3.7 17.3 21.0 Indiana 12.7 3.6 16.3 17.0 5.2 22.2 Iowa 11.4 1.9 13.3 20.6 3.7 24.3 Kansas 17.5 8.7 26.2 26.6 8.8 35.4 Kentucky 12.9 4.3 17.2 19.0 6.4 25.5 Louisiana 18.5 12.5 31.0 25.0 19.5 44.5 Maine 1.4 4.2 5.5 2.6 7.4 10.0 Maryland 6.7 12.4 19.2 7.5 21.9 29.4 Massachusetts 1.8 25.2 27.0 3.4 39.4 42.8 Michigan 3.3 4.4 7.7 5.5 9.7 15.3 Minnesota 4.4 5.9 10.3 5.2 14.2 19.4 Mississippi 20.9 4.3 25.2 25.3 5.3 30.5 Missouri 8.3 3.1 11.4 11.2 3.9 15.1 Montana 3.2 1.2 4.4 4.3 0.2 4.4 Nebraska 14.7 9.1 23.9 20.5 16.0 36.4 Nevada 19.5 9.2 28.7 31.9 10.1 42.0 New Hampshire 2.6 7.4 9.9 3.1 5.9 9.0 New Jersey 13.2 7.7 20.9 20.0 20.3 40.4 New Mexico 7.0 6.9 13.9 10.6 11.1 21.6 New York 1.3 8.2 9.5 2.8 23.6 26.4 North Carolina 8.4 4.1 12.4 11.7 5.7 17.4 North Dakota 8.8 1.5 10.4 9.8 7.3 17.1 Ohio 5.2 2.3 7.5 7.4 6.8 14.2 Oklahoma 19.0 12.5 31.5 27.3 26.6 53.9 Oregon 0.3 4.8 5.1 1.4 11.9 13.2 Pennsylvania 4.1 10.1 14.2 5.5 20.8 26.3 Puerto Rico 0.0 0.1 0.1 0.0 0.0 0.0 Rhode Island 6.9 12.7 19.5 5.6 16.7 22.4 South Carolina 19.1 4.3 23.4 25.3 6.3 31.6 South Dakota 16.0 3.5 19.5 21.7 3.3 25.0 Tennessee 25.6 9.3 34.9 36.2 13.0 49.2 Texas 42.8 15.1 57.9 64.2 45.9 110.1 Utah 23.6 10.6 34.2 34.7 14.8 49.5 Vermont 0.0 0.3 0.3 0.1 0.6 0.7 Washington 1.7 5.1 6.8 4.0 13.5 17.5 West Virginia 4.2 2.5 6.7 8.2 4.3 12.6 Wisconsin 4.0 1.3 5.3 6.5 3.5 10.0 Wyoming 19.3 5.8 25.2 35.6 6.0 41.6 Combined Virginia and Washington D.C. 11.3 19.3 30.6 17.7 40.6 58.3 Total 12.8 9.2 22.0 19.2 20.7 40.0 See appendix table 2
Footnotes
-
Data on the true scale of the criminalization of immigration have been limited and still do not include all Department of Homeland Security enforcement actions. They also do not include federal arrests that lead to federal criminal charges related to immigration. According to ICE detention statistics, Border Patrol agents made thousands of arrests nationally. Nonetheless, these ICE arrest data appear to shed some light on the matter. ↩
-
ICE makes arrests out of many incarceration and pretrial detention facilities, ranging from police department lock-ups, county jails, state prisons, and federal prisons, which we’re referring to as “other lockups.” Because more recent arrest data provided by ICE no longer distinguishes between arrests through the local, state and federal parts of their so-called “criminal alien program,” we combine for this analysis. See the methodology for more information. ↩
-
These deputization agreements are commonly called 287(g) agreements, and range from dispatching law enforcement to serve ICE administrative warrants to people in local custody, investigative and paperwork duties for ICE, transportation of people from local jails to ICE detention centers, and participation in inter-agency taskforces. These agreements are an entirely separate issue from local jails renting bedspace to ICE on a contract basis. ↩
-
See the methodology for more information. ↩
-
For detailed state-by-state arrest numbers and rates, see the appendices. ↩
-
See the methodology for details on how we arrived at our analysis. We have also published these data in state-by-state appendix tables. ↩
-
In Illinois, of almost 500 arrests out of lock-ups in the latter period, at least 100 were from the Metropolitan Correctional Center operated by the Bureau of Prisons in the Loop or another federal facility. Due to ICE providing less detail about custodial arrests for late July to October, we cannot distinguish federal lock-up specific arrests for much of that time period. ↩
-
For more information see the Illinois Attorney General’s Safer Communities website and relevant Illinois Legal Code. ↩
-
Compared to New York, New Jersey had a large share of people arrested that had “pending” criminal charges but no prior criminal convictions between May 21, 2025 and October 15, 2025. In New York, only 13% of people ICE arrested had pending charges but no prior convictions, compared to 34% in New Jersey. Of those ICE arrested in New Jersey that actually had convictions during this time, the most frequent “most serious criminal charge” was merely a traffic offense.
ICE has field offices that cover arrest and deportation operations in different parts of the country. Only New Jersey, Arizona, and Florida have state-specific, statewide ICE field offices. This institutional arrangement may have an impact in terms of partnerships with local law enforcement. Usually, ICE field offices serve more than one state (for example, Chicago’s field office covers six states). ↩
-
Miller reportedly threatened staff with demotions and termination if they did not ramp up arrests and raids. Immediately thereafter, the Department of Homeland Security began indiscriminate arrests in Washington D.C. and expanded raids on people that were presumed to be undocumented based on their appearance and line of work in large scale operations in Los Angeles. While initial litigation blocked these arrests for a time, this strategy of biased immigration policing was authorized in an order from the Supreme Court, with a notorious concurring opinion by Justice Kavanaugh, earning them the moniker, “Kavanaugh Stops.” ↩
See all the footnotes
-
-
AuthorPosts


- You must be logged in to reply to this topic.