- This topic is empty.
-
AuthorPosts
-
-
August 20, 2025 at 3:14 am #10482
Farrydesigner
KeymasterEven though the rate of youth incarceration is more than three times lower than it was twenty years ago, youth of color and youth with disabilities are still overrepresented in custody — and these disparities are getting worse.1
These children were already among the most vulnerable to involvement in the juvenile legal system, but as the system decarcerates, their vulnerability is compounded by the fact that they are also among the most likely to suffer abuse while confined, including being violently victimized by adults.
New research underscores the extent to which staff violence against incarcerated neurodivergent youth of color is substantially worse than it is for white neurotypical youth.2 Brianna Suslovic and her colleagues at the University of Chicago Crown Family School of Social Work, Policy, and Practice, identified significant disparities in the likelihood of staff physical assault between confined youth of different racial identities, and between neurodivergent and neurotypical incarcerated youth. They found that the odds of Black youth reporting staff physical assault are 79% higher than the odds of white youth reporting assault, and the odds of neurodivergent youth reporting staff assault are 59% times higher than the odds of neurotypical youth reporting assault. Even more alarmingly, for neurodivergent youth of color, the odds of reporting staff physical assault are more than twice the odds of their white, neurotypical peers.
These findings, forthcoming in the Journal of the Society for Social Work and Research, are based on data collected by the federal government in the 2018 National Survey of Youth in Custody. Suslovic and her co-authors have made a useful contribution to existing research because they use self-reported data to examine how structural forces and marginalization — in this case, racism and ableism — shape experiences of youth confinement. The evidence they present underscores the need to keep those at the highest risk of abuse at the forefront of decarceration efforts, and to ensure they don’t enter youth jails and prisons in the first place.
Methodology
The underlying data in the study are from the 2018 National Survey of Youth in Custody, a nationally representative survey of 6,910 youth in 332 publicly- and privately-operated facilities that house adjudicated3 youth across the country.4 The survey is intended to gather data on the incidence and prevalence of sexual assault in juvenile facilities under the Prison Rape Elimination Act of 2003 (PREA). Data are self-reported by youth participants, and the survey collects information on the racial identity, gender identity, age, sexual orientation, and diagnoses of several mental health and developmental disorders.
The researchers used survey data to identify respondents who reported any diagnosis by a doctor, counselor, or other professional of ADD/ADHD, dyslexia, a learning disability, Autism, or Asperger’s Syndrome, which the researchers used to categorize participants as “neurodivergent.”5 Suslovic and her colleagues estimated the prevalence of staff physical assault of neurodivergent and neurotypical — or non-neurodivergent — youth across racial categories based on the response to the survey question that asked youth to report if they had ever been “kicked, punched, hit, and otherwise physically assaulted” by facility staff. Given the limited information on physical assault by facility staff in juvenile facilities,6 the researchers rely on youth reporting assault as a proxy for the frequency of assaults in youth confinement. This requires an assumption that the likelihood of confidentially reporting an assault is generally consistent across demographic categories in the survey. The researchers also controlled for a number of variables that may be associated with increased risk of victimization including history of prior physical abuse, assignment of a caseworker or social worker, age, education level, gender identity, and sexual orientation.7
There are some inherent limitations to this study. First, the National Survey of Youth in Custody relies on self-reported data, which is susceptible to over- and under-reporting, but is generally found to provide accurate estimates.8 Second, the researchers’ definition of “neurodivergence” may differ from other definitions, as there is no general consensus in the literature about the specific diagnoses and conditions of neurodivergence. Third, the racial, ethnic, and gender identities of youth were limited to the categories presented in the administered survey, which therefore limits responses to a set number of possibilities of identity categories for race, ethnicity, and gender.9
Confined youth of color and neurodivergent youth disproportionately experience violence at the hands of facility staff
The study finds that children of color and neurodivergent children are disproportionately confined in juvenile facilities, and that neurodivergent children of color in particular are more likely to report being physically assaulted by staff than white, neurotypical children.
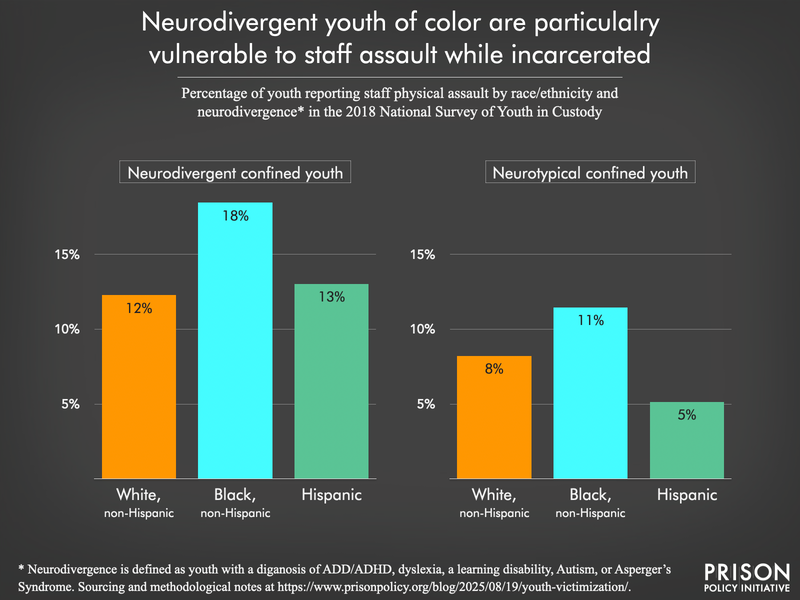
Overall, more than 1 in 10 incarcerated youth report being assaulted by staff. However, among neurodivergent confined youth, a greater proportion (15%) reported being assaulted by staff. In fact, the odds of neurodivergent youth reporting violent victimization by staff were 59% higher than the odds of their neurotypical peers. In the analysis across race, the researchers found that Black youth have odds of reporting staff physical assault that are 79% higher than white youth, with almost 1 in every 6 Black youth reporting assault, compared to 1 in 9 white youth.
The researchers also found that across almost all racial categories, staff physical assault is more prevalent among neurodivergent youth.10 Neurodivergent youth of color experience a distressing 120% higher odds of reporting being assaulted by staff than their white, neurotypical peers. This is particularly alarming, as it indicates the extent to which the children most vulnerable to involvement in the juvenile system are made additionally vulnerable to violence at the hands of adults in power.
Despite great strides in youth decarceration, longstanding disparities in confinement are getting worse
The great strides made in youth decarceration over the past twenty years have not been evenly distributed. People of color and those with disabilities, who have often been primary targets for surveillance, policing, and incarceration,11 still represent a greater portion of the dwindling confined youth population than their white and neurotypical peers. In fact, their overrepresentation in the system is growing, and they continue to face the very kinds of abuses that have motivated decarceration of youth jails and prisons in the first place.
The conditions in youth jails and prisons — which can include solitary confinement, physical abuse, sexual abuse, a lack of programming and services, and excessive use of force& #8212; make juvenile confinement particularly dangerous for youth with disabilities, and can exacerbate mental and behavioral health concerns.12 Overall, confined youth face exceptional risk of victimization by facility staff: systemic maltreatment — including physical abuse and excessive use of force by staff — has been reported in juvenile facilities in 29 states since 2000, and a 2010 survey found 22% of confined youth reported that they were afraid that a staff member will physically attack them.13
The data from this newest study support these concerning trends, further quantifying the overrepresentation of youth of color and neurodivergent youth in confinement, and characterizing their mistreatment in a shrinking system.
Youth with disabilities are disproportionately locked up
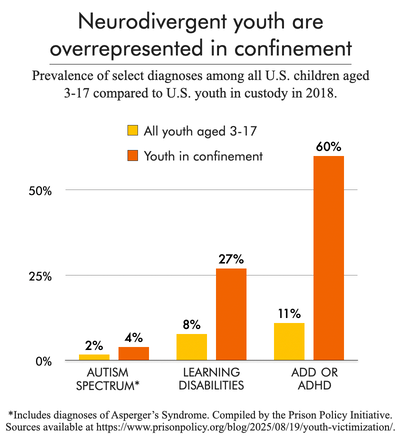
More than two-thirds of confined youth met the study’s criteria for neurodivergence, which the researchers defined as any diagnosis by a doctor, counselor, or other professional of ADD/ADHD, dyslexia, a learning disability, Autism, or Asperger’s Syndrome. The prevalence of many of these diagnoses is much higher among children in custody than in the national youth population:14
- ADD/ADHD: 60% of youth in custody compared to 11% of youth nationally;
- Learning disabilities: 27% of youth in custody compared to 8% of youth nationally; and,
- Autism: 4% of youth in custody compared to 1.7% of youth nationally.
In addition, more than half (55%) of neurodivergent confined youth were Black, Hispanic, American Indian or Alaska Native, Asian, or Native Hawaiian or Pacific Islander.
While youth with disabilities represent 17% of national K-12 enrollment, they represent almost one quarter (24%) of confined youth.15 Children with disabilities face some of the highest rates of arrest in schools, in part because police are often called to respond to youth who have challenges with processing emotions and information, communication, and disability-related behaviors. Youth of color with disabilities are arrested at even higher rates in schools, with Native Hawaiian and Pacific Islander boys and Black boys with disabilities facing rates four to six times the average arrest rate.16
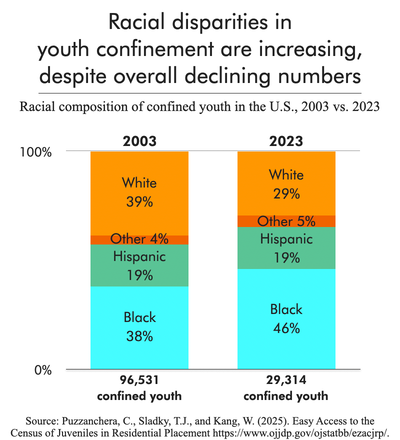
Racial disparities are increasing in youth confinement
Racial disparities have long been a feature of youth incarceration, and they’re only getting worse. In 2003, Black youth accounted for 38% of youth detained or committed, and in 2023, this increased to over 46%. In addition, youth of more than one race accounted for only 1% of confined youth in 2006 (the first year juvenile data included that race category), and that proportion has more than doubled as of 2023.
Some of these disparities can be traced back to differences in the policing of kids of different races and ethnicities. As is the case with Black adults, Black children are particularly targeted with overcharging and harsher treatment, making them far more likely to be incarcerated than white children. Black children, and especially Black girls, are also subject to an added burden of adultification: when a child is perceived as older, more culpable, and more responsible than their peers. Similar to the racist “super predator” myth that was used to rationalize harsh punishments in the 1990s by portraying Black youth as more violent and unruly than their white peers, adultification leads to harsher consequences within the juvenile legal system.
Conclusion
The findings from Brianna Suslovic and her colleagues represent important contributions to the existing research, highlighting how some of the most vulnerable children are funneled into the juvenile legal system, where they face a number of dangers, including physical assault by staff.
Violent victimization is the product of several factors in youth confinement. Almost one-third of the study sample reported physical abuse by an adult prior to confinement, and we know that prior victimization is a strong indicator of subsequent victimization while in custody. Research also shows that the quality of relationships with facility staff can influence the likelihood of victimization — and other positive and negative outcomes for incarcerated youth and adults — and the vast majority (89%) of confined youth reported that they were assigned a case manager or counselor. Educational access and engagement have been identified as protective factors against maltreatment for children as well. Despite evidence that people who achieve higher levels of education while incarcerated are more likely to experience positive outcomes after release, less than one-third of confined youth have completed high school, even though more than 60% of confined youth are over 17 years old.17 Many of the same factors that make children more vulnerable to criminal legal system involvement also make them more vulnerable to suffering abuse while confined, and this study calls particular attention to some of the youth most disproportionately at risk of violent victimization by adults.
While the number of confined youth has been declining for years, the confined population still reflects the racist and ableist trends of the nation’s criminal legal system: children with histories of abuse, lower education levels, learning disabilities, cognitive disorders, disabilities, and children of color are disproportionately locked up. Those are the children who remain in juvenile facilities where they are at heightened risk of physical assault at the hands of the people charged with their safety and wellbeing. Given the pronounced failure of youth incarceration to significantly reduce “delinquent” behaviors and the dangers they experience behind bars, the findings from this recent study signal a need to reevaluate our nation’s use of incarceration for children.
Footnotes
-
In 2003, 113 per 100,000 youth were confined in juvenile facilities, and by 2023, this rate fell to 34 per 100,000, according to data from the Office of Juvenile Justice and Delinquency Prevention (OJJDP). ↩
-
As explained in detail in the Methodology section of this briefing, the study authors define “neurodivergent” as any diagnosis by a doctor, counselor, or other professional of ADD/ADHD, dyslexia, a learning disability, Autism, or Asperger’s Syndrome. “Neurotypical” youth are youth who report no history of any of those diagnoses. The study authors also analyzed the findings by race and ethnicity: white, Black, Hispanic, other races (including Asian American and Indigenous), and two or more races. For some findings, they report the differences between white youth and youth of color (defined as all non-white race and ethnicity categories). ↩
-
Because this survey focuses on facilities holding adjudicated youth (or youth whom the juvenile court had determined have committed the act with which they are charged) it does not necessarily reflect the experience of youth awaiting adjudication, such as those in pretrial juvenile detention. ↩
-
The researchers were only able to use the survey results from 5,718 youth (83%) that responded to the necessary questions for their analysis. ↩
-
Prior to the administration of the National Survey of Youth in Custody, the newest iteration of the Diagnostic and Statistical Manual, the DSM-5, was published in 2013. The DSM-5 is the main guide for mental health and brain-related conditions and disorders. In that iteration of the reference book, “Autism” and “Asperger’s Syndrome” were consolidated into “Autism spectrum disorder” to encompass the wide range of symptoms and the severity of those symptoms. ↩
-
Unlike the reports about sexual victimization of youth in confinement that come from the same dataset (the National Survey of Youth in Custody) there are no reports from the Bureau of Justice Statistics reporting on the prevalence of substantiated vs. reported incidents of physical assault by staff. ↩
-
Sexual and gender minority youth are at elevated risk for staff sexual victimization while in custody, although there is little evidence regarding the prevalence of staff physical assault across any demographic. ↩
-
For example, the National Crime Victimization Survey is regularly used to accurately and reliably estimate crime. ↩
-
The survey may not capture all trans or gender nonconforming youth, as they may have identified with the “male” or “female,” leaving the researchers no ability to delineate cisgender and transgender youth. ↩
-
Rates of reporting staff physical assault are higher among neurotypical youth for only one racial category: youth of more than one race. ↩
-
Black people — including youth — are vastly overrepresented in police stops and arrests, and experience police misconduct at a rate six times that of white people. People of color — especially Black and Native people of all ages — are disproportionately jailed and imprisoned as well. People with disabilities are overrepresented in all interactions with the criminal legal system, and are particularly vulnerable to police violence and victimization during incarceration. ↩
-
Incarcerating youth has a number of serious consequences for their well-being including worse physical health outcomes in adulthood, higher rates of depression, increased likelihood of future incarceration, and shorter life expectancy. ↩
-
In addition, data from the National Survey of Youth in Custody in 2018 reveal that 6% of confined youth reported sexual victimization by staff. ↩
-
While the study included diagnoses of dyslexia in the definition of neurodivergent, there is little consensus on the national prevalence of dyslexia to compare the findings to outside of the confinement setting. ↩
-
The 2021-22 Civil Rights Data Collection from the U.S. Department of Education defines disability based on the Individuals with Disabilities Education Act (IDEA), and includes autism, hearing and visual impairments, intellectual disability, severe orthopedic impairment, specific learning disabilities, speech or language impairment, and traumatic brain injuries.
This estimate of 24% is likely an underestimate of the actual proportion of confined children with disabilities: some sources report that up to 70% of confined youth have disabilities (the definitions of disabilities frequently vary between studies). ↩
-
While Native Hawaiian/Pacific Islander and Black girls face the highest arrest rates among girls with disabilities, arrest rates across all races are highest for boys and nearly 85% of confined youth are boys. ↩
-
19% of juvenile facilities surveyed by the U.S. Department of Education in 2021 offered less than 20 hours of educational programming during a five-day week (less than 4 hours per day). ↩
-
-
AuthorPosts


- You must be logged in to reply to this topic.